What is it that drives a customer's price sensitivity. What dictates how much or how little somebody is willing to pay for a product. We will begin with some of the most common elements that define price sensitivity.
Product comparison is the primary factor that really drives price sensitivity. Imagine on the shelf product A, made by manufacturer Johnson & Johnson, and right next to it on the shelf is product B, a private brand made by the retailer. If the products are located side by side and relatively easy to compare and you discover they are comprised of the same contents, chances are you may purchase the less expensive private labeled product. When a comparison is simple, consumer price sensitivity typically goes up. Ideally, as a seller or as an entrepreneur your goal is to make price comparison against your product and your competitor's product somewhat difficult for the customer. Your concentration should be on the quality of your product or your service.
The second crucial element driving price sensitivity is the amount of total expenditure. When shopping for new tires for your car, if one set of tires is priced at $500 while the other set is $600, you might purchase the $500 tires as the extra $100 is a substantial difference in price. On the other hand, if you are buying a car for $20,000 and the dealer says you can have high mileage tires for $600 or the cheap tires for $500 you might think, what's another $100 bucks on a $20,000 purchase? When we consider investments in percentage terms or as a small piece of overall expenditure, our price sensitivity goes down.
As a seller, the implication is to convince the buyer that what they are buying is a small piece of an overall picture. Another factor to consider is whether or not there is a separation between the buyer and the payer. For instance, as an employee of a school, you may try to save the school money when you purchase a coach class ticket to fly from Philadelphia to San Fransisco and then attempt to upgrade into first class if you are lucky. Sometimes you might choose to buy a first-class ticket knowing that you will be reimbursed for it. In this example, payment was made by the institution and not the employee thus resulting in less price sensitivity as the money came from somewhere else.
When there is a separation in time or method of payment, a curious result transpires. Uber passengers can contact Uber via their mobile phone, and the Uber driver will take them wherever they desire. At the conclusion of the ride, passengers exit the vehicle and no money exchanges hands as the bill is sent via a text message on the mobile device. Merely no psychological pain is experienced for the transaction because no cash is required. Imagine having to take $20 cash out of your wallet every time you used Uber, you might consider an alternative such as walking or taking the subway. When payment occurs via the mobile phone, you become less price sensitive as you do not feel it directly. This is another example where price sensitivity is reduced.
When there is a price-quality inference people tend to become less price sensitive. To illustrate, if someone needed to hire an attorney for assistance with problems at the immigration service do you think they would choose Amy's low-cost lawyer service at $50 an hour or do you think they would seek Chris's expert attorneys at $500 an hour. In this illustration, there is an inference that the higher price leads to higher quality service, and price sensitivity is again lessened.
These scenarios are examples of how customers become psychologically less price sensitive. This begs the question, how is price sensitivity measured? Is it done intuitively or is additional research required? There are four methods to determine price sensitivity.
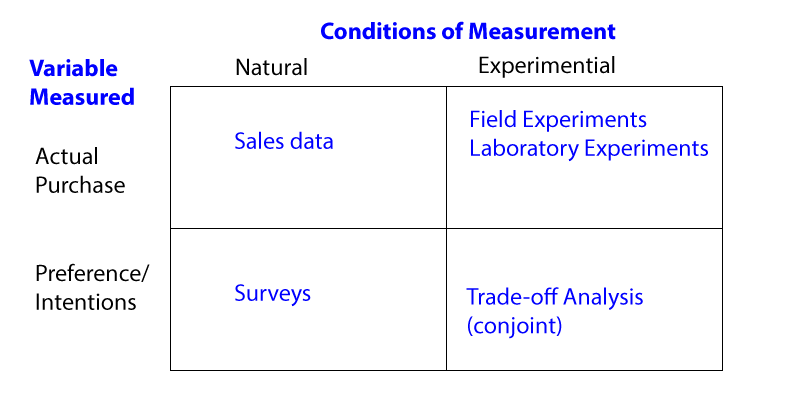
The chart above is a two by two matrix that explains these four different methods. People can be measured in their natural environment regarding their buying behavior and the first column includes a survey that can be completed. Another option includes running an experiment in an unnatural environment. Ultimately it is a control either in the field or the lab. Still another choice involves engaging in trade-off analysis. Those are the two columns of this matrix. The rows show actual purchase behavior can be recorded by simply measuring their preferences and intentions. The following example is an experiment conducted by, Professor Steve Hoch of the Wharton School. He set out to understand whether or not supermarket retailers could raise or lower prices.
Professor Hoch worked with an institution in Illinois called Dominick's Finer Foods, a supermarket chain located in the Chicago area. In one group of stores, all of the prices were systematically lowered by about 9% on a variety of products, including detergents, paper towels, canned tuna, and more. In another group of stores, the prices on the same items were kept as is. In the third group of stores, the prices of those goods were increased by 9%. This is a classic experiment with a control group where prices are manipulated upward and downward followed by a review of what occurred. What they discovered was fascinating. They found that when prices were raised, demand went down slightly. Customers did not take notice of the 9% incremental price increase. Experimenters concluded the drop in demand was minimal and as a result profits increased quite a bit. This experiment would reveal those multi-product retailers could probably raise their prices by a little bit.
Some psychological reasons why this works in a grocery environment is it is highly unlikely customers will pay attention to every single price and try to remember it. Now this study was conducted in the 1990s, and the results might be different if they did it today. The technology of today's smartphone allows users to maintain their entire grocery list on their phone. Apps such as Save On or the SnipSnap Coupon App assists customers in recalling prices, or at least their mobile device will do it for them.
Professor Paul Green, a former Professor at the Wharton School, developed another method to measure price. Professor Green, is the father of conjoint (trade-off) analysis, one of the most widely-used quantitative methods in Marketing Research. It is used to measure preferences for product features, to learn how changes to price affect demand for products or service, and to forecast the likely acceptance of a product if brought to market. The following is a personal example illustrating this method.
In a conjoint exercise, respondents usually complete between 12 to 30 conjoint questions. The questions are designed carefully, using experimental design principles of independence and balance of the features. By independently varying the elements that are shown to the respondents and observing the responses to the product profiles, the analyst can statistically deduce what product features are most desired and which attributes have the most impact on choice.
Sawtooth Software demonstrates sample surveys here: Conjoint survey examples
When asked directly on a survey how much they're willing to pay, people often respond with a low ball price. A more accurate response is documented when surveys indirectly present the same question. For example, the survey could ask, here's a pair of Warby Parker glasses for $95. On a scale of one to seven, one meaning very unlikely to buy, seven meaning very likely to buy, how likely would you be to buy this product? The group replies with an average score of six. The identical survey given to another group asks, how likely would you be to buy these glasses for $105? On a seven-point scale, the average score from that group is only five. Results show the accurate method of setting the price is obtained indirectly through a survey.
Regression analysis involves taking some real sales data, reviewing various prices and factors that affect sales, and computing correlation. Regression analysis aids in forecasting price sensitivity, just as in economics the price elasticity of demand is computed by doing statistical and quantitative analysis. Measuring price sensitivity can be accomplished by four different methods. They include directing experiments, running statistical regression analysis, conducting surveys, or generating a conjoint analysis. All four of these methods will work to obtain a measurement of price sensitivity.
In certain countries and cultures, digits in prices have particular meanings. Nine's in a western society typically indicate a discount or sale of some sort, they are considered a special kind of number. This explains why many products are priced at $2.99, $3.99, and how $1999 somehow feels better than $2000. From a psychological point of view, the demand curve is not always as smooth as it doesn't still go down even if this particular price is on the X-axis.
Demand does not necessarily drop despite an increase in prices and it doesn't always fall evenly. Over the course of a year, a simple experiment was conducted in some supermarkets in the U.K. where the regular price of margarine was about $0.83., and at $0.83 the supermarket was selling a couple thousand units every week. When they discounted the product to $0.63, the demand went up, and it increased by almost 200%. Lowering the price $0.20 led to a 200% increase in demand. Further, when the experimenters lowered the price a bit more, from $0.63 down to $0.59, the increase relative to the $0.83 price was 406%. This is a classic example of a threshold or a nonlinear response to a price reduction. By reducing the price another $0.04 or just a small percentage, it almost doubled the lift. For more information on pricing read Timeless Strategies to Increase Sales
Be aware that customers who pay full price one day, only to see products discounted the next, are now educated to buy when products are discounted. There will always be another sale right around the corner, after all. So the brand loses its efficacy because the story the customers believe changes. The meaning customers once attached to the brand gradually erodes until the irreplaceable brand becomes an interchangeable commodity.